Zajištění konzistentního výkonu
pro koncového uživatele i aplikace
Application Infrastructure Analysis
 Consistent application delivery is critical for business. OptiView™ XG makes it easy to identify and analyze the underlying network infrastructure of an application. This lets you become proactive about application performance issues. It also decreases the time required to isolate network vs. application problems
Path Analysis
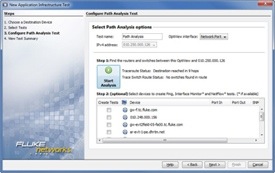 Path Analysis helps you understand the exact path taken by the application to quickly resolve application performance issues due to infrastructure. Path Analysis easily identifies the devices that are critical for application performance. With Path Analysis you can monitor all the interfaces that are along the path of the application. It also provides packet loss, delay and response time at each device to identify the device causing any issues.
Path Analysis also enables you to keep a close eye on interface utilization along the path and any other system resources at the server.
Speed up troubleshooting application and network performance issues by automatically validating that network services such as DHCP, and DNS are available and operating correctly, ensuring that server and application connectivity is accessible by opening specific TCP IPv4 and IPv6 ports on servers and reporting the round trip time as a combination of network latency and server connection set up time. Ensure servers are operating efficiently by viewing resources including number of users, processor, memory and disk utilization and services and process that are running.
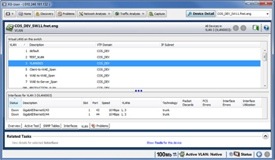
Trace SwitchRoute™
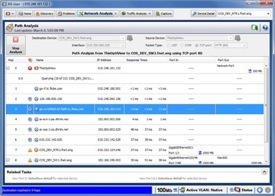 Trace SwitchRoute allows you to see the exact path two devices use to communicate through your switch and router fabric. During Path Analysis, a combination of layer 2 and layer 3 trace routes identifies the entire network path between the application client and the application server, speeding problem isolation. During the discovery, if a switch is discovered in the path, Trace SwitchRoute starts its switch path discovery. The displayed results include the DNS name and IP address, the inter-switch connections by port number, together with link speed and VLAN information. Highlighting any device in the Trace SwitchRoute name column and selecting Device Detail allows you to view that device’s network configuration information.
Real-time NetFlow finds bandwidth hogs
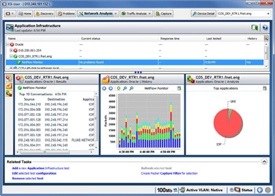 OptiView XG uses NetFlow to give you valuable insight into bandwidth usage in your enterprise without the complexity and expense involved in a traditional NetFlow analysis setup. The Application Infrastructure Analysis tests in the OptiView XG can collect NetFlow data from flow-enabled routing devices, and uses it to analyze network traffic and report on bandwidth usage across the network. Get instant real-time bandwidth usage reports on top applications, conversations, and hosts using bandwidth, for fast troubleshooting.
The ONLY tablet with 10 Gbps “On-The-Wire” analysis
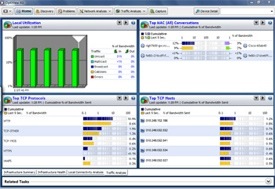 OptiView XG provides line rate, real-time application and traffic analysis and troubleshooting on 10/100/1000 Mbps or 10 Gbps links. Identify top talkers, multicasters and broadcasters or select top conversations to determine which hosts may be over-utilizing resource bandwidth. Tap or span key links to determine who is using server bandwidth by viewing top conversations to a single host. Analyze protocol mix to identify top protocols being used and also discover unwanted and custom protocols and see which protocols are being used by each host. These real-time statistics for traffic “on the wire” enable you to understand how network resources are being used and increase user satisfaction with faster response times for networked applications.
OptiView XG automatically discovers all protocols and sub protocols from the MAC layer to the application layer. This enables IT staff to identify applications (including those that use dynamically assigned port numbers) utilizing link bandwidth to see and validate the impact of applications on network resources and also identify illicit applications. Deep packet inspection differentiates between specific audio, video, image, and data applications, and shows the level of bandwidth usage for each.
VLAN Visibility and Trunk Analysis
 Only “on the wire” analyzers can provide vision into actual VLAN trunk traffic. When connected to a switch trunk port, the OptiView XG will detect all VLANs available on that trunk, measure the traffic distribution across all the VLANs and provides the user with the capability of selecting a specific VLAN.
If an individual VLAN is selected, device discovery, traffic statistics and packet capture data will be displayed only for that VLAN.