Intuitivní uživatelské rozhraní
s možností individuální konfigurace, chytré navigace a snadného reportování
User Configurable Dashboards
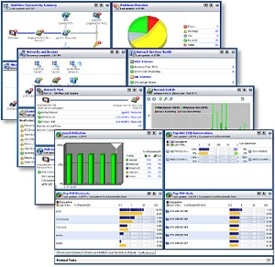 Present the relevant data to the right audience. OptiView XG has extensively customizable dashboards that help transform collected data into an actionable presentation. The dashboard can be customized to a particular user or for the entire enterprise. Create dashboards for keeping a close eye on network and applications by site or even by business function. These dashboards can be saved and exported to different members of your team. The dashboard provides an at-a-glance overview of the current status of your network, with critical metrics from routers, switches, firewalls, servers, services, application, and other infrastructure devices.
Remote users can also set up dashboards to get their own view of network operations.
Performance Health Checks
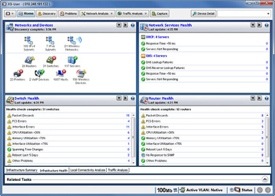 Every day, your business depends on a reliable, secure and fast network. Already stretched IT resources are being asked to do more and network maintenance and optimization are often overlooked. The results are unhealthy networks that are improperly utilized, misconfigured and vulnerable to cyber threats.
At-a-glance visibility provided by Health Checks will help you put your critical infrastructure and applications back on track and keep their performance optimized and running smoothly.
Virtualization Health
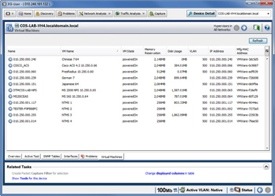 Enterprises are virtualizing servers to obtain cost savings and flexibility. Along with the benefits of virtualization comes the new complexity of managing the virtualized network. OptiView XG has built-in capability to analyze Virtual Machines and their host VMware ESX servers. This gives you the capability to quickly track virtual server health at-a-glance and ensure your mission critical applications never fail. OptiView XG’s discovery also gives the capability to find and analyze new virtual machines that are added to ESX host servers.
Quickly check the health of your VMware ESX Server by monitoring CPU, memory utilization, number of virtual machines configured and running, and much more. View VM name, guest OS, and VM state, and detailed virtual machine health statistics including processor, memory, and network usage.
Network and Application Issue Reporting Engine
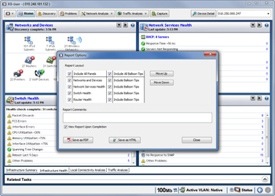 OptiView XG offers a number of built-in reports, making it quick and easy to report on application and network problems. These reports help you track performance and utilization statistics. While viewing a screen, pressing the Reports key will generate HTML or PDF reports on Protocols, Top Hosts, Top Conversations, Devices, Networks, Problems and many more.
The intuitive interface facilitates customizing the out-of-the-box reports and also enables creation of completely customized reports using the configurable dashboards in just a few clicks. The ability to choose what data to populate in a report enables users to quickly see data exactly the way they need. You can even create reports for specific user profiles, making it easy to generate reports for specific departments or recipients.