Aplikační centrální analýza
 Application issues are difficult to solve and slow performance or outages have serious implications for the business. It is critical to get a view of traffic captures in terms of applications on the network to easily identify bottlenecks. OptiView™ XG provides a comprehensive, high-level overview of the health of applications on your network with easy to use drill down capabilities to gain access to more detailed information.
Full line-rate capture ensures complete analysis
Get 10 Gbps line-rate packet capture and filtering to troubleshoot problems where packet level analysis is required and perform advanced troubleshooting when deploying and analyzing applications.
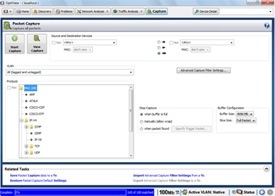
Sophisticated capture filters allow collection of more relevant data and limit the amount of traffic to analyze by filtering on individual addresses or conversation, IPv4 address range or subnet, or IPv6 prefix and protocols. The capture size can be up to 4GB.
The capture process may be started or stopped through a user defined trigger event – capture the traffic before, after or around an event occurrence without being present. This ensures you capture the event the first time and avoids initiating random traffic captures that may not contain anything of interest.
OptiView XG’s unique user interface makes the complex task of setting up filters and triggers as simple as touching the devices or protocols of interest, eliminating errors that result from misconfiguration.
Free String Match to find and capture anything
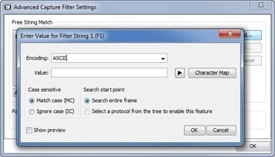 Match any set of words or phrases when detected (regardless of the position in the packet – payload or header) in real-time to trigger the OptiView XG to start or stop capturing and/or filter traffic. Use Free String Match to capture traffic around any application error message, detect traffic containing certain words or phrases in non-encrypted emails, web pages, file transfers or documents to identify illicit use of the network or detect downloading of restricted documents based on content or filenames (.doc, .xls, .pdf). Additionally, use Free String Match to identify and track applications that are not allowed on the network such as streaming media that may consume valuable bandwidth, or P2P traffic that may pose a security risk. A total of eight sets of triggers or filters can be defined to trigger a capture unattended for later analysis, allowing analysis when you have time, not when the event occurred.
Simplified troubleshooting of application problems
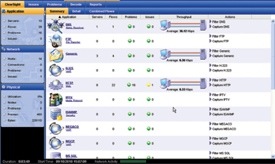 Once traffic is captured, launch the Integrated ClearSight™ Analyzer (iCSA) to see an application-centric view of the trace file. Through a simple and intuitive front page, iCSA presents a comprehensive, high-level overview of the health of applications on your network. From that framework, you can drill down to gain access to more detailed information. For example, you can display all the activity for HTTP applications, then drill down to see activities on each server, and further down to the server flow to observe the actual media content of the flow. iCSA also provides time-based analysis providing detailed trending and statistical information for fast analysis of large capture files. This unparalleled level of control and visibility speeds time to application problem resolution and minimizes overall network downtime.
Automated problem/issue detection
 The CSA Expert Alert function automatically detects communication faults in captured packets and displays them with color coded icons. The specific application, server, or flow that has a problem can be seen at a glance from the Application Summary Home screen. Alerts detected by CSA are classified as issues (faults in the communication sequence) or problems (faults that exceed a threshold value) and can be listed separately. Lists can be sorted by simply clicking on a column header. You can drill down to the associated communication flow by right-clicking on an alert.
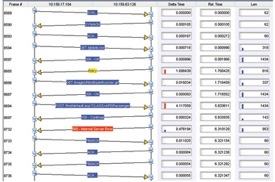
Unique and powerful bounce chart illustrates application flow
CSA application bounce chart views reveal conversations between client and server in the application command language without having to decode packets manually. It provides an extremely powerful way to understand protocol interactions between various network elements.
Content reconstruction and playback
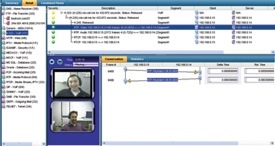 You can recreate audio and video content from VoIP or video flows, either during real-time monitoring or from a trace file. In addition, Microsoft® Exchange® email, Fax over IP, Instant Messages and HTTP-based web pages can also be reconstructed. This is very valuable as proof of compliance violation or visualization of multimedia quality.
Troubleshoot 10 Gbps network and application performance problems from the data center to the access layer – fast
When problems happen, your job is to fix it – fast – and perform deeper analysis for determining the root cause. The OptiView XG Network Analysis helps you resolve network and application performance issues in real-time using unique features such as proactive analysis, path analysis, and application-centric analysis, vendor-independent infrastructure analysis, on-the-wire traffic analysis, and full line-rate packet capture/decode. Expert-assisted application centric protocol analysis provides guidance – not just data – to solve tough application and network problems, even if you’re not a packet decode expert.
« Zajištění konzistentního výkonu | Integrovaná WLAN analýza »